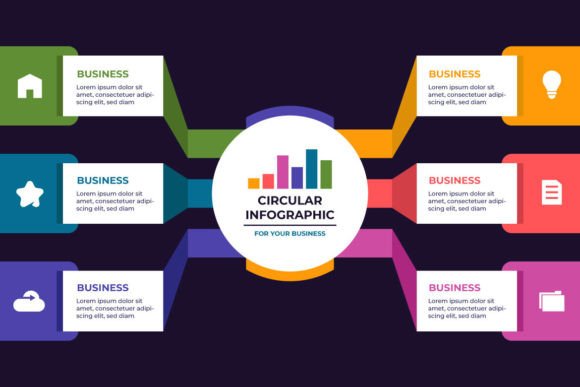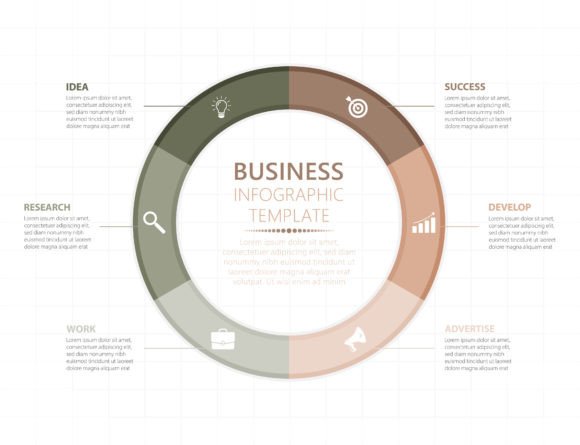
Transforming Ideas with a Six Steps Process Infographic
Have you ever stared at a complex business challenge, a new marketing campaign, or a course curriculum, feeling overwhelmed by the sheer volume of moving parts? Our brains are wired to process visual information far more efficiently than text or abstract concepts. This is where the power of a Six Steps Process Business Infographic becomes invaluable. It’s not just a graphic; it’s a structured visual framework that transforms chaos into clarity, turning a linear or cyclical workflow into an accessible, engaging story.
What Makes This Six-Step Framework Unique
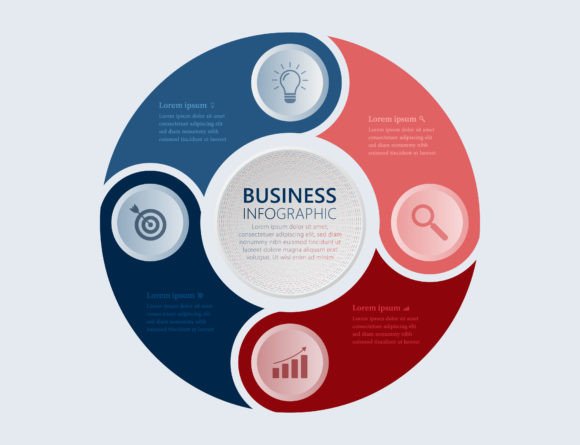
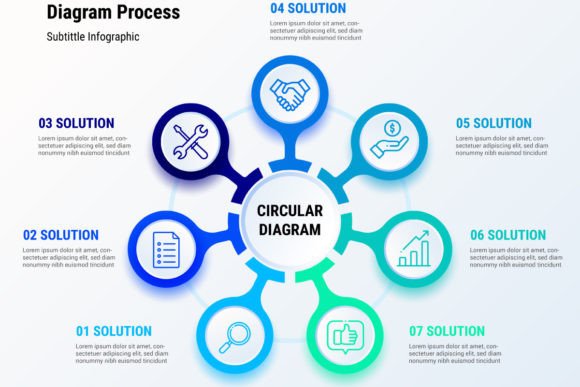
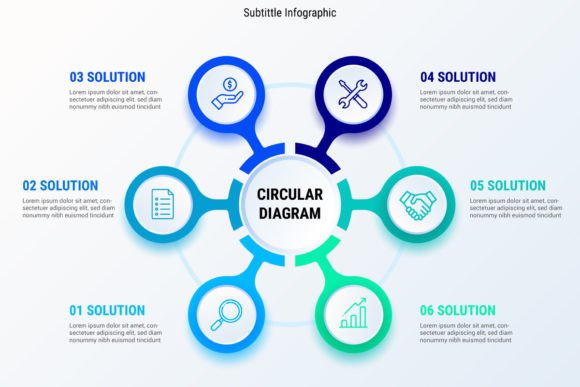
At its core, a Six Steps Process Business Infographic provides a skeleton for narrative and logic. The number six is particularly effective—it offers enough stages to detail a substantial process without becoming unwieldy or overwhelming for the viewer. Unlike a simple list, a well-designed infographic, especially one utilizing a circle or flow diagram, implies relationship and progression. It visually answers the critical questions: Where do we start? What comes next? How do the phases connect? And where does it all lead?
Key characteristics of a high-quality template include visual balance and intuitive navigation. A circular diagram, for instance, can brilliantly represent a recurring cycle, like a content marketing calendar or a customer feedback loop. Each segment is distinct yet part of a cohesive whole. The strength lies in its dual nature: it’s a planning tool for you and a communication tool for your audience. Its notable quality is simplification without dilution—it distills complexity into its essence.
Putting the Visual Process to Work
The applications for this type of visual asset are remarkably broad. Let’s move beyond theory and look at where it actively drives value.
For entrepreneurs and small business owners, it can map out the entire customer journey from awareness to loyalty, making it easier to identify gaps in service or opportunities for engagement. It can also outline a product development pipeline, giving a fledgling team a shared reference point.
In marketing and advertising agencies, these infographics are used internally to plan campaign rollouts and externally to showcase their strategic process to clients, building trust through transparency. A six-step circle chart can elegantly show the lifecycle of a digital ad campaign: Research, Concept, Create, Launch, Monitor, Optimize.
Educators and course creators find them indispensable for structuring syllabus material. Breaking a complex subject into six progressive modules, visualized in a circle, helps students grasp the learning path and see how foundational knowledge builds toward advanced topics. It’s a syllabus that students actually remember.
Beyond Communication: The Strategic Benefits
The benefits extend far beyond making something "look nice." First, it forces critical thinking. To create a coherent six-step process, you must deeply understand your subject, identify the true sequential or cyclical dependencies, and prioritize the most impactful elements. This exercise alone improves strategy.
Second, it dramatically enhances communication and alignment. Whether you’re presenting to a board, briefing a freelance team, or explaining a process to a new hire, a single visual reference eliminates confusion and ensures everyone is literally looking at the same map. It reduces meeting time and miscommunication.
Third, it contributes to professional branding. Consistently using clear, well-designed process visuals in your proposals, reports, and website signals competence and modern thinking. It shows you value clarity and respect your audience’s time. Furthermore, these infographics are highly engaging. In a digital landscape saturated with text, a colorful, logical diagram captures attention and improves information retention, whether in a social media post, a blog article, or a live presentation.
Selecting and Implementing Your Template
With source files often provided in formats like EPS, SVG, DXF, PNG, and JPG, you have flexibility. The vector formats (EPS, SVG, DXF) are crucial for professionals who need to edit and scale the graphic without quality loss—perfect for branding where you’ll adapt colors and text. The PNG and JPG are ready for quick use in digital content.
When evaluating a template, look for one with a clean, uncluttered base design. The structure should be clear, but the decorative elements shouldn’t be so specific that they lock you into a single industry theme. You want a canvas, not a finished painting. Consider your primary output: if it’s mainly for web and print, PNG/JPG and SVG are key. If you need to integrate it into fabrication or large-format signage, the DXF might be relevant.
Implementation is straightforward but requires thought. Customize the text concisely; each step label should be a clear action or phase. Use color strategically to group related steps or indicate progression. Most importantly, ensure the visual logic matches your real-world process. If your process is iterative, a circle is ideal. If it’s a linear funnel with a clear end, a flow diagram might be better. Don’t let the template dictate your logic—use it to express it.
In practice, a blogger might use a Six Steps Process Business Infographic to outline "The Recipe for a Perfect Blog Post" – Research, Outline, Draft, Enhance, Publish, Promote—making their content creation method clear to readers. A project manager could use it in a client kickoff meeting to visualize "Our Project Success Cycle": Define, Plan, Execute, Review, Adjust, Deliver. It turns abstract service promises into a tangible, trustworthy roadmap.
A Tool for Clarity in a Complex World
Ultimately, the value of this tool is universal. In any field where processes exist—from software development to event planning, from academic research to creative freelancing—the act of visualizing those steps is a act of mastery. It helps you control the process and, just as importantly, it helps others understand and trust it. A Six Steps Process Business Infographic is more than a slide or an image; it’s a lens that brings focus to ideas, a bridge that connects planning to execution, and a common language that teams and audiences can share. In a world demanding both efficiency and engagement, having such a lens at your disposal is not just useful; it’s a professional advantage.