Your Business Process, Visualized: The Power of a Workflow Chart Infographic
We’ve all been there. Trying to explain a complex business process, whether it’s how a customer order gets fulfilled, how a new employee gets onboarded, or how a creative campaign goes from brainstorm to launch. Words alone often fail us, leaving team members or stakeholders confused. This is where a Business Workflow Chart Infographic becomes not just a nice-to-have, but a vital communication tool. It’s a visual map that transforms abstract steps and responsibilities into a clear, easy-to-follow diagram.
What Exactly is a Business Workflow Chart Infographic?
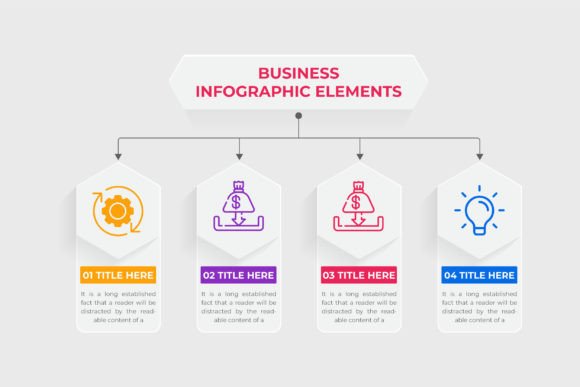
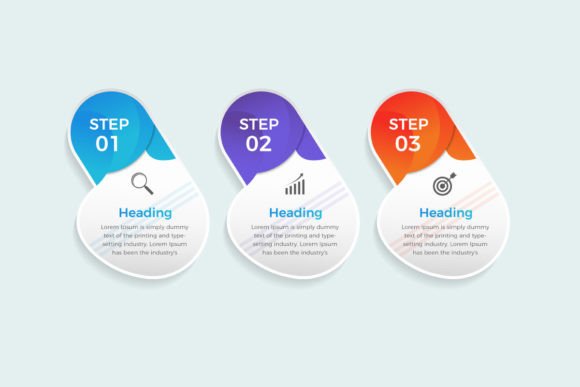
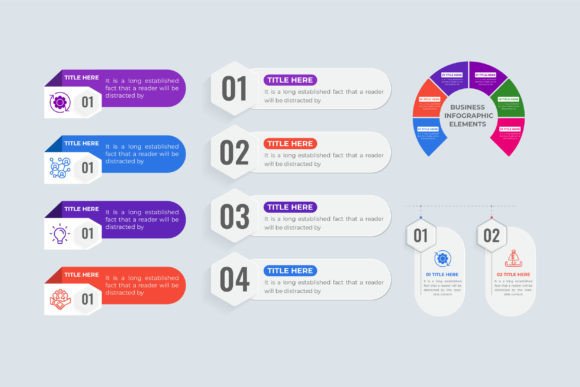
Think of it as the visual backbone of your process. At its core, a Business Workflow Chart Infographic is a diagram that uses symbols, icons, arrows, and concise text to illustrate the sequence of tasks, the flow of information, and the points of decision within a specific business operation. Unlike a dry, text-heavy procedural manual, an infographic leverages design principles—color coding, spatial layout, and visual hierarchy—to make the workflow immediately understandable. It answers the critical questions: Who does what? When do they do it? And what happens next?
The magic lies in its dual nature. It’s both a chart, providing a logical structure, and an infographic, making that structure engaging and memorable. This combination is perfect for modern offices where clarity and speed of understanding are paramount.
The Real-World Scenarios Where a Visual Workflow Shines
You might be wondering, "Is this for me?" Let’s move past theory and look at concrete situations where introducing a workflow chart infographic can resolve friction and boost efficiency.
For Team Alignment and Training
When a new process is rolled out or a new team member joins, a page of bullet points is a poor welcome gift. A visual workflow chart serves as a universal reference point. For example, in a marketing agency, a chart detailing the client approval process—from initial concept draft to legal sign-off to final publication—can prevent emails from going to the wrong person and deadlines from being missed. It gives everyone, from the intern to the department head, a shared mental model of how things work.
For Client and Stakeholder Presentations
Explaining your company’s service delivery or project methodology to clients can build immense trust. A clean, professional Business Workflow Chart Infographic in a presentation shows you are organized, transparent, and in control. A software development firm might use one to visually walk a client through their agile development cycles, clearly showing stages for design, coding, testing, and deployment. This reduces anxiety and miscommunication, as the client literally sees the path their project will take.
For Process Improvement and Problem-Solving
Often, inefficiencies hide in the gaps between steps. By mapping your current workflow visually, you create a tool for diagnosis. A manufacturing team might chart their quality control checkpoint process. Seeing it laid out, they might instantly spot a redundant inspection or a bottleneck where materials wait too long. The chart becomes the starting point for the conversation: "Where can we simplify or streamline this flow?"
For Creative and Content Production
Creative work feels fluid, but it often follows a strict process to meet deadlines and maintain quality. A video production team’s workflow infographic could map everything from scriptwriting and pre-production, through filming and editing, to final distribution. This helps creative talents understand where their piece fits into the larger pipeline and what’s needed from them at each stage, balancing creativity with practical project management.
Tailoring the Workflow Chart to Different Users and Industries
The beauty of this tool is its adaptability. Its value changes slightly depending on who’s using it and in what field.
For a Project Manager, it’s a control document to assign tasks and track progress against a visual timeline. For an HR Specialist, it’s a recruitment and onboarding guide, ensuring every candidate gets the same experience and every new hire knows what paperwork to complete and whom to meet. In the Healthcare sector, a simplified workflow chart can explain patient admission procedures to administrative staff, improving coordination. In E-commerce, it can visualize the order fulfillment journey for warehouse teams, highlighting packing, shipping, and notification steps.
The purpose also varies. Sometimes it’s for instruction (training new staff). Sometimes it’s for analysis (finding process flaws). Sometimes it’s for promotion (showing clients your robust methodology). One well-designed infographic can serve multiple purposes across the organization.
Practical Considerations Before You Dive In
Creating or choosing a Business Workflow Chart Infographic requires a bit of forethought. It’s not about just picking pretty icons.
First, know your audience. A workflow for engineers might tolerate more technical detail and specific jargon. A chart intended for broad company communication or clients should use simpler language and more universal symbols. Second, focus on accuracy over artistry. The primary goal is to reflect the real process correctly. A beautiful but inaccurate chart causes more harm than a plain but correct one.
Consider the level of detail. Do you need a high-level overview showing major phases, or a granular diagram listing every micro-task? Start with a broader view; you can always create more detailed charts for specific sub-processes later. Also, think about format and flexibility. Having the chart in a vector format, like the designs offered at Iftikhar Alam Graphic Store, is a practical advantage. It means you can easily edit colors, text, and icons in software like Adobe Illustrator to keep it updated as your business process evolves.
The Strengths and a Gentle Limitation
The strengths are compelling: enhanced comprehension, reduced training time, improved cross-departmental coordination, and a professional appearance in presentations. A visual workflow democratizes understanding—it makes complex processes accessible to everyone, regardless of their role or seniority.
A potential limitation to keep in mind is that a workflow chart captures a prescribed process. Business is dynamic, and exceptions always occur. The chart is the ideal path, the standard operating procedure. It’s crucial to remind users that it’s a guide, not an unbreakable rulebook, and that adaptability for edge cases is still necessary. The chart provides the framework; human judgment fills in the gaps.
Ultimately, a Business Workflow Chart Infographic is more than just office decoration for a presentation slide. It’s a foundational piece of internal communication and operational clarity. By visualizing the steps, you unify your team, impress your clients, and give yourself a powerful lens to examine and improve how work actually gets done. Whether you create one from scratch or utilize a professionally designed template as a starting point, the effort to visualize your workflow is almost always repaid in smoother operations and fewer confused conversations.