What Is a Flat Table of Contents Infographic?
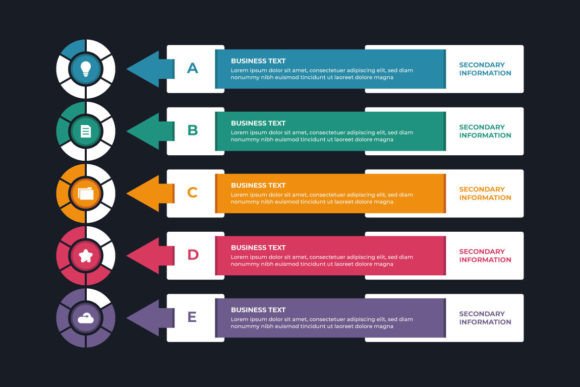
When you need to organize complex information quickly, a Flat Table of Contents Infographic can be your visual shortcut. Imagine a traditional table of contents from a book—a structured list of chapters and sections—but designed as a clean, modern graphic. This is not a 3D or illustrated piece; it’s a "flat" design, meaning it uses simple shapes, minimal colors, and clear typography to present a hierarchy of information in a single, easy-to-digest layout.
The Core Purpose and Value of This Visual Tool
The main goal of a Flat Table of Contents Infographic is to replace a lengthy, text-heavy index with a visually intuitive guide. Its characteristics include a clear grid or structured layout, concise labels, and a logical flow from top-level points to supporting details. The value lies in its ability to communicate structure instantly. For a reader, viewer, or user, it answers the question, "What’s here, and where do I find it?" without requiring them to read through paragraphs of explanation.
This format has a broad appeal because it balances professionalism with accessibility. It looks polished enough for a corporate report yet straightforward enough for a personal blog. The "flat" design style ensures it doesn’t distract with decorative elements; the information itself is the focus.
Who Needs a Table of Contents Infographic and Why?
You might be interested in using or creating a Flat Table of Contents Infographic if you regularly deal with information that needs to be structured and presented clearly. It supports a common problem: overwhelming your audience with disorganized content. Whether your goal is to improve comprehension, enhance navigation, or simply make your material look more professional, this tool can help.
For example, a small business owner creating a lengthy service manual might use it to help clients find sections faster. An educator designing a course syllabus could employ it to visually outline modules for students. A marketer compiling a data-heavy whitepaper might embed one at the start to guide readers through the key findings. The need is universal—any situation where clarity and time-saving are priorities.
Real-World Applications Across Different Fields
Let’s look at some concrete, beginner-friendly examples of where this infographic format shines.
- Digital Publishing: On a website or eBook, a Flat Table of Contents Infographic at the beginning of a long article or guide acts as a visual anchor. Readers can quickly scan it and click directly to the section that interests them most.
- Professional Reports & Proposals: In business contexts, these infographics can preface annual reports, project plans, or investor pitches. They provide executives and stakeholders with an immediate overview of the document’s structure and key focus areas.
- Educational Materials: Teachers and trainers can use them in lesson plans, workshop agendas, or online learning modules. A visual table of contents helps students grasp the course flow and learning objectives from the very first slide.
- Creative Projects: Freelancers and hobbyists, such as those creating complex craft tutorials or photography portfolios, can use one to organize their project steps or gallery sections, making their work easier for others to follow.
Key Considerations for Using This Format Effectively
Before you decide to create or implement a Flat Table of Contents Infographic, there are a few important things to consider. First, your information must have a legitimate hierarchy. If your content is a simple list with no subsections, a basic bulleted list might suffice. This tool is best for content with clear main topics and subtopics.
Second, think about design consistency. The infographic should match the visual style of the rest of your document or website. Using complementary colors and fonts will make it feel like an integrated part of your project, not an afterthought.
Finally, consider the technical aspect of creation and sharing. You'll often see these files offered with the note "INCL FILE EPS AI CDR SVG." This means the infographic source files are included in various vector formats. EPS and AI files are typically for Adobe Illustrator, CDR for CorelDRAW, and SVG for web use. If you plan to edit the design—to change colors, text, or layout—having these source files is crucial. They allow you, or a designer you hire, to customize the infographic perfectly for your needs. If you don’t need to edit it, a simple PNG or JPEG might work, but having the vector files ensures future flexibility.
Bringing Your Infographic to Life Across Platforms
Once you have your Flat Table of Contents Infographic, how do you apply it? The included file formats (EPS, AI, CDR, SVG) give you versatility.
- For Print: Use the EPS or AI file to ensure high-quality printing in brochures, handouts, or physical reports.
- For Digital Documents: Embed the SVG or a high-resolution PNG into PDFs, PowerPoint presentations, or Word documents. SVG files are particularly good for digital use because they scale perfectly without losing quality.
- For Online Use: The SVG format is ideal for websites and blogs as it’s lightweight and renders crisply on any screen size. You can also use it in email newsletters to provide a clear overview of linked content.
The key is to match the file format to your output medium. This practical consideration ensures your infographic looks professional everywhere it appears.
Making the Final Decision
Choosing to use a Flat Table of Contents Infographic ultimately comes down to assessing your content and your audience. If your material is structured and your audience values quick, clear navigation, it’s a strong choice. Remember, its power is in simplification. Don’t force it onto content that is inherently narrative or linear; use it where a bird’s-eye view is genuinely helpful.
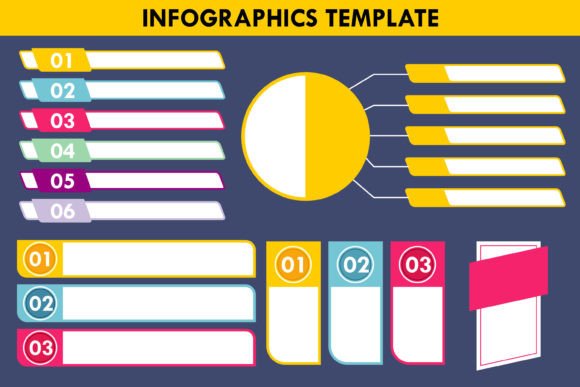
Start by sketching out the main sections and subsections of your project on paper. If that sketch already looks like a helpful map, then a designed infographic will elevate it. Look for pre-made templates or source files (those that include EPS, AI, CDR, SVG) if you’re not a designer, as they provide a solid starting point you can adapt. The goal is always to serve your audience better, turning potential confusion into immediate understanding with a single, well-designed visual.