Infographic Glass Morphism Banner Design: The Modern Visual Tool
In the world of digital and print visuals, a trend has emerged that combines clarity with style: Infographic Glass Morphism Banner Design. This aesthetic is not just a fleeting trend; it's a functional design philosophy that brings data and decoration into sharp, attractive focus. At its core, it uses the visual metaphor of glass—transparency, light, blur, and subtle borders—to create layered, sophisticated graphics that feel both modern and soft.
What Exactly Is Glass Morphism in Design?
Before diving into banners and infographics, let's break down the style itself. Glass morphism, or "glassmorphism," mimics the look of real glass. Key characteristics include a semi-transparent background, a light border to define edges, and a subtle background blur effect that makes the element appear to sit above its backdrop. This creates a sense of depth and separation without harsh lines.
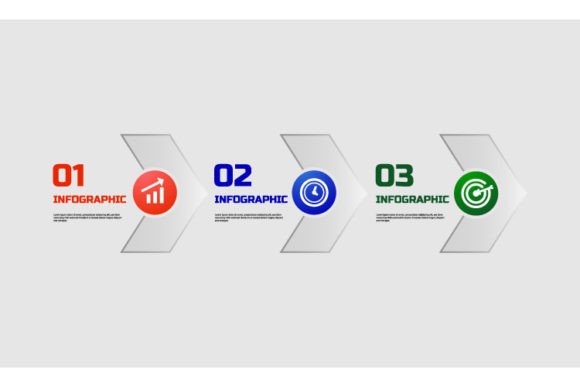
When applied to Infographic Glass Morphism Banner Design, these principles transform standard data presentation. Instead of flat charts on a solid color, you get visual elements that seem to float on the canvas. Information feels layered, organized, and integrated into a cohesive, premium-looking composition. This style is particularly effective for capturing attention while maintaining a clean, uncluttered feel.
The Perfect Blend: Infographics Meets Decorative Banners
An infographic's job is to explain. A banner's job is to attract. Infographic Glass Morphism Banner Design accomplishes both. It serves as a hybrid visual tool. For instance, a banner for a corporate sustainability report might use glassmorphism panels to display key metrics—carbon reduction, recycling rates—over a beautiful nature photograph. The data is clear and readable on its translucent panels, while the overall banner remains an artistic, decorative piece suitable for print or digital display.
This duality makes it incredibly versatile. It fits into projects where aesthetics and information must coexist equally. Think of event decoration banners that also outline the schedule, or website hero sections that introduce a company with elegant, floating statistics.
The Practical Benefits of Using This Design Style
Why choose this approach over a more traditional flat design? The benefits are both perceptual and practical.
- Enhanced Depth and Hierarchy: The transparent, blurred layers naturally create a visual order. Important data points can be placed on foreground "glass" panels, while background imagery provides context without competing. This guides the viewer's eye effortlessly.
- Modern and Premium Perception: The style carries a contemporary, high-tech association, often linked to sleek UI design. Using it in your banners signals an updated, professional brand.
- Versatility Across Media: A well-executed infographic glass morphism banner design can seamlessly transition from a digital screen (PNG, SVG) to a printed poster (EPS, JPG) without losing its core appeal. The translucency effects can be simulated in print through careful color and overlay choices.
- Focus on Content: By softening the background, the style inherently spotlights the content on the glass panels—your infographic data. It reduces visual noise.
Key Considerations Before You Start
While attractive, this style requires thoughtful execution. Here are factors to consider.
First, background selection is critical. The glass effect relies on what's behind it. A busy, high-contrast background can make text on translucent panels hard to read. Often, a softly textured, gradient, or blurred backdrop works best.
Second, accessibility must be maintained. Ensure text contrast is sufficient. The transparency should not reduce legibility. You might need to adjust the opacity of your "glass" panels or add a very light solid fill behind text.
Finally, understand your output formats. The supplied files—AI, EPS, PNG, JPG, SVG—each serve different purposes.
Navigating the File Formats: AI, EPS, PNG, JPG, SVG
When you acquire or create an Infographic Glass Morphism Banner Design, getting the right file format for your project is essential. Each format has a distinct role in modern design workflows.
- AI (Adobe Illustrator): This is the native, editable source file. It's for designers who need to modify the artwork, change colors, adjust data, or scale elements infinitely without quality loss. It’s the master key.
- EPS: A legacy vector format still valuable for print production. Many professional printing systems accept EPS files for large-format banners, decoration materials, or signage. It maintains vector scalability.
- PNG: The go-to for digital use where transparency is needed. If your glass morphism banner has genuine transparent areas (like the blurred edges of a glass panel), PNG preserves that. Ideal for web graphics, presentations, or digital overlays.
- JPG: A universal raster format. Use it for situations where file size matters and transparency isn’t required, such as email attachments, certain print proofs, or embedding in documents. The glass effect will be rendered on a solid background.
- SVG: The modern web vector format. For developers or web designers, SVG allows the banner to scale perfectly on any screen size (responsive design) and can sometimes allow CSS interactivity. It’s perfect for infographic banners used on websites or apps.
Choosing the correct format depends on your final use: intricate print decoration (EPS), a flexible web element (SVG), or a quick social media graphic (PNG).
Real-World Applications and Scenarios
Where does this design fit in practice? Its application crosses multiple industries and activities.
In marketing and corporate communications, these banners become centerpieces for annual report covers, trade show booth backdrops that educate visitors, or interactive digital annual summaries. The elegance boosts brand perception while delivering facts.
For event planning and decoration, imagine a conference where the main stage banner isn't just a logo but an infographic glass morphism design highlighting the event's key themes, speaker count, and participant demographics. It serves as both atmosphere and information.
In element design and UI/UX, individual glass morphism components from the banner—like a single statistic panel—can be extracted (using the SVG or AI file) and reused as interactive elements on a dashboard or app, maintaining design consistency.
As a background, the entire composition, with its layered glass and soft imagery, can function as a premium desktop wallpaper or a website section background, where other UI elements are placed over it, continuing the depth effect.
Integrating into Your Design Workflow
Adopting Infographic Glass Morphism Banner Design into your projects isn't overly complex, but it does require a shift in layering thinking.
Start by planning your information hierarchy. What data points are most important? Those should likely be on the topmost, most defined "glass" layers. Secondary information can sit on slightly more transparent panels.
Use your design software (like Adobe Illustrator, hinted at by the AI file format) to create the background first, then build up. Apply transparency, inner shadows for thickness, and delicate borders. The blur effect can be achieved through layer effects or by manually creating blurred backdrop duplicates.
Remember, the goal is cohesion. The infographic elements shouldn't look like they're pasted onto a picture; they should feel like integrated parts of a single visual story. Color consistency between the glass panels and the background helps achieve this.
Finally, test your design across mediums. Check readability on a printed proof (using your JPG or EPS) and on a digital screen (using your PNG or SVG). This ensures your infographic glass morphism banner design truly works for its intended purposes: print, decoration, element design, and background.
By mastering this style, you equip yourself with a powerful visual tool that speaks with both authority and beauty, making complex information not just understandable, but also engaging and memorable.