Bringing Your Plans to Life with Colorful Teamwork
Imagine you’re in a meeting, presenting a quarterly financial report or mapping out a new marketing workflow. The data is solid, the strategy is sound, but the slides on the screen are a monotonous sea of gray boxes and black text. The audience is listening, but are they truly engaged? This is where the concept of Colorful Teamwork in planning and presentation design makes a transformative difference. It’s more than just making things look pretty; it’s a strategic approach to visual communication that leverages color and design to clarify, organize, and motivate.
A Practical Approach to Complex Information
At its core, Colorful Teamwork in planning is the use of a coordinated set of vibrant visual elements—like infographic charts, icons, and segmented layouts—to represent different parts of a project, team roles, data sets, or process steps. Each color isn’t chosen randomly; it’s assigned a meaning. For instance, blue might represent the research phase in a workflow, orange could denote the creative team’s tasks, and green might highlight financial milestones. This creates an immediate visual language that anyone can understand, reducing the cognitive load needed to parse complex information.
The main purpose is to enhance comprehension and collaboration. When a plan is color-coded, team members can instantly see their responsibilities and how they interconnect with others. In a project timeline infographic, a red section slowing down immediately signals a bottleneck needing attention. The value lies in turning abstract plans into tangible, visual stories. This appeals not only to our logical side but also to our visual memory, making details easier to recall and discussions more focused.
Solving Real Problems in Everyday Work
Why should a blogger, a startup founder, or a freelance educator care about this? The problems it solves are universal: information overload, poor team alignment, and audience disengagement. Many professionals struggle to present dry data—like annual sales figures in a financial report—in a way that sparks interest and insight. A colorful, well-designed chart set can highlight growth trends, risks, and opportunities far more effectively than a spreadsheet excerpt.
For a small business owner creating a service brochure, using a colorful layout to explain their process steps can make their offering feel more modern, trustworthy, and easy to follow. An entrepreneur pitching to investors can use color-coded slides to visually separate market analysis, product development, and financial projections, making the pitch clearer and more persuasive. The goal it supports is simple: better communication. The need it addresses is the constant pressure to stand out and be understood quickly in a busy world.
From Presentations to Personal Projects
The applications of this colorful planning concept are vast. In professional contexts, it’s the backbone of compelling presentation slide templates for board meetings, client reviews, and internal training. Each slide becomes a coherent part of a visual story. In creative fields, designers use these elements to map out user experience workflows or content calendars, where each color represents a different platform or content type.
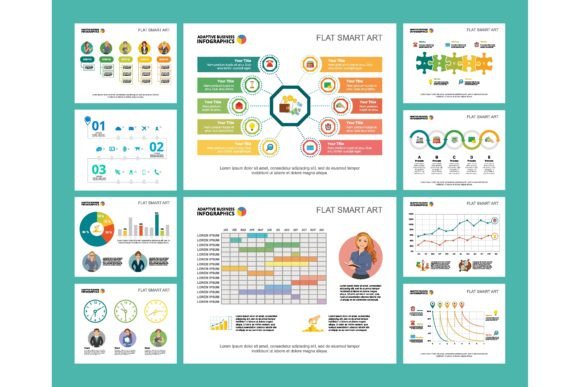
Educational use is equally powerful. Teachers and trainers can design infographics to explain historical timelines or scientific processes, where color differentiation helps students follow complex sequences. For personal and lifestyle projects, imagine planning a community event or a home renovation. A colorful Gantt chart or layout can help visualize tasks, deadlines, and who’s handling what, keeping everything organized on a single, clear page.
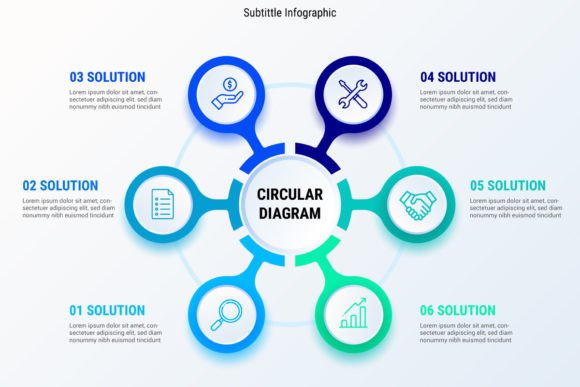
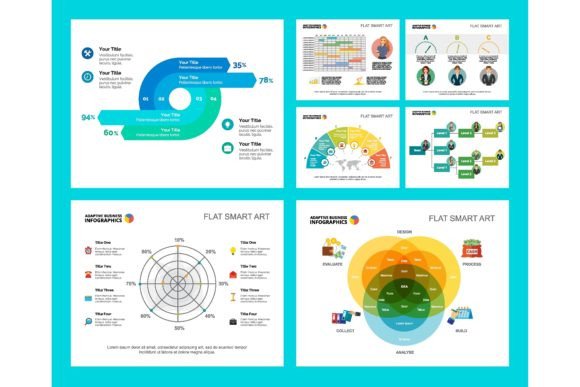
Consider a realistic example: a marketing team using a colorful infographic chart set in their quarterly review. Instead of listing metrics in text, they use a radial chart where each color segment represents a channel—social media (orange), email (blue), SEO (green). Performance data fills each segment. Instantly, the team can see which channel is outperforming and where resources might need rebalancing. The discussion shifts from “What are the numbers?” to “Why is the orange segment so large, and what does that mean for our strategy?”
Key Considerations Before You Start
Embracing this approach requires some thoughtful planning. First, consider consistency. Your color scheme should be meaningful and consistent across all materials—your report, your slides, your brochure. Don’t use blue for finances in one chart and blue for creative ideas in another; this creates confusion. Establish a simple color legend early on.
Secondly, remember that color is a tool, not a substitute for substance. The underlying data, plan, or strategy must be robust. Colorful teamwork elements amplify good content; they cannot mask poor planning. Also, be mindful of accessibility. Ensure there is sufficient contrast so that information is clear for everyone, and consider using patterns or labels alongside color for those with color vision differences.
Finally, start with the templates and design sets available. Many digital resources offer pre-designed colorful infographic charts and business elements for presentation slides. These can be excellent starting points, especially for beginners. Customize them with your own data and meanings rather than designing from scratch. This saves time and ensures a professional baseline while allowing you to apply the Colorful Teamwork concept immediately to your financial report, workflow layout, or brochure design.
The Human Element of Visual Planning
Ultimately, the appeal of Colorful Teamwork in planning is deeply human. We are visual creatures. A well-organized, colorful plan doesn’t just inform; it invites participation, builds enthusiasm, and fosters a sense of shared purpose. When a team can look at a vibrant project map and literally see their collective progress, morale and accountability improve. When a client sees a brochure where your services are laid out in an intuitive, colorful flow, their confidence in your organization grows.
It bridges the gap between raw information and human understanding. Whether you’re a solo freelancer structuring your service offerings or a large corporation presenting annual results, applying this concept means you’re not just sharing data—you’re designing a clearer, more collaborative, and more engaging path forward for everyone involved.